6. How CSPM displays data
CSPM displays histograms that provide information about system usage.
The program has 8 display tabs for the different types of system information CSPM
collects. These tabs are:
System Overview
IRQs
CPU Utilization
Memory
Network
Storage
Tests
Test Summary
The key at the bottom of the histogram tables on each of the tabs tells how to interpret
the various colors representing data in the tables.
Use the horizontal and vertical scroll bars to view any histograms that do not
fit on the initial screen.
6.1. System Overview tab
When CSPM starts up, the System Overview screen is displayed. The histograms
on the System Overview screen show data for the total system, including CPU, memory,
network, and storage usage. The following screenshot shows a sample view of a
System Overview screen.
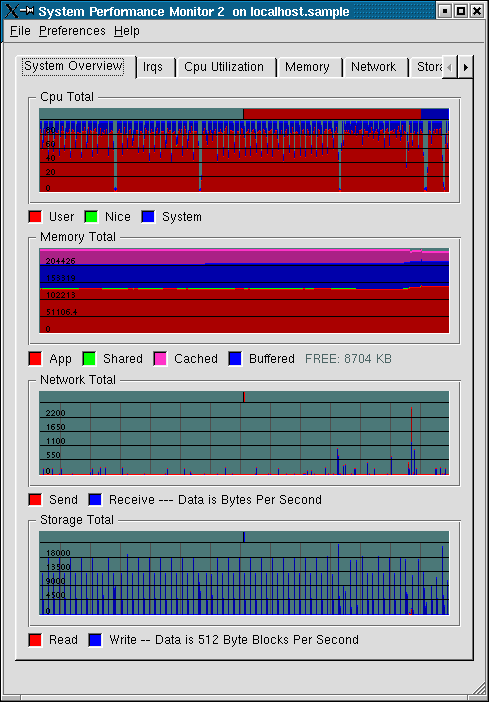
Below each histogram is a key that describes the data that is represented. For example, in the
CPU total histogram, the red line represents user CPU usage, the green line represents commands run with a modified scheduling priority (nice), and the blue line represents system CPU usage.
6.2. IRQs tab
When you click the IRQs tab, a histogram opens for each IRQ line that
runs to an ISA slot
on the system. The following screenshot shows a sample view of the IRQs screen.
 | Note |
|---|
| | With Qt 3.0, the horizontal scroll bars on the Irqs tab does not work properly. This
problem does not occur with Qt 3.1. |
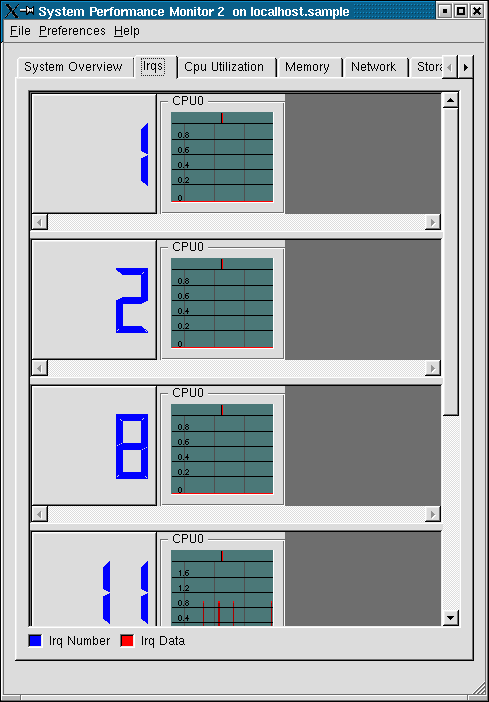
The large blue number to the left of the histogram is the number of the IRQ.
The
red line on each histogram represents the number of IRQs per second utilitized by the device
connected to the IRQ's ISA slot.
6.3. CPU Utilization tab
When you click the CPU Utilization tab, histograms open for each CPU
on the system, as
shown in the following screenshot:
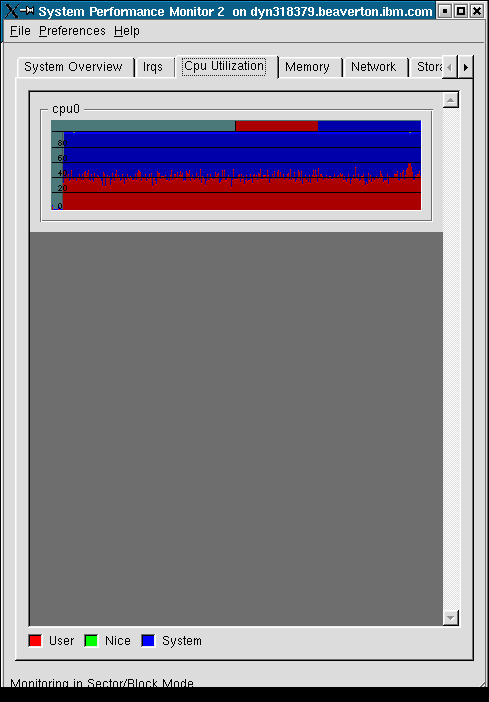
The histograms show information about user (red), system (blue), and nice priority (green) command utilization.
6.4. Memory tab
The Memory tab is still under development. In a future release of CSPM,
the Memory tab will graphically show how much memory processes use, from most to least.
6.5. Network tab
When you click the Network tab, histograms that show the amount of traffic on the system's loopback device and each network device are displayed, as shown in the following screenshot.
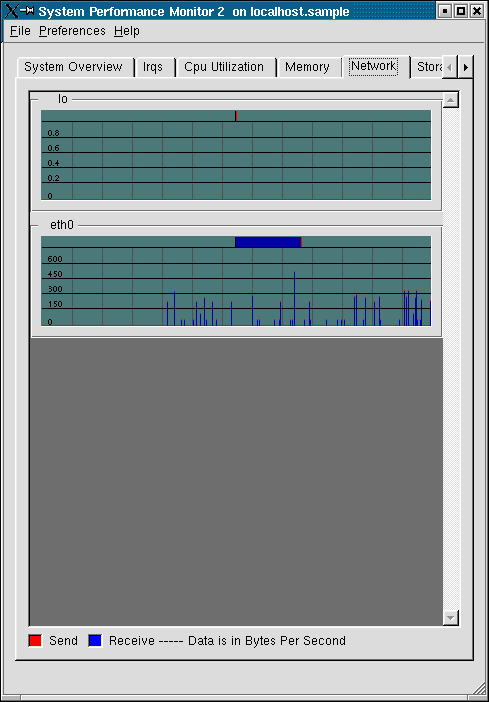
Sends are shown in red and receives are shown in blue.
6.6. Storage tab
When you click the Storage tab, a collection of histograms opens that
show data
for controllers, disks, and partitions.
The key at the bottom of the histograms tells which
color of histogram box corresponds to which type of device.
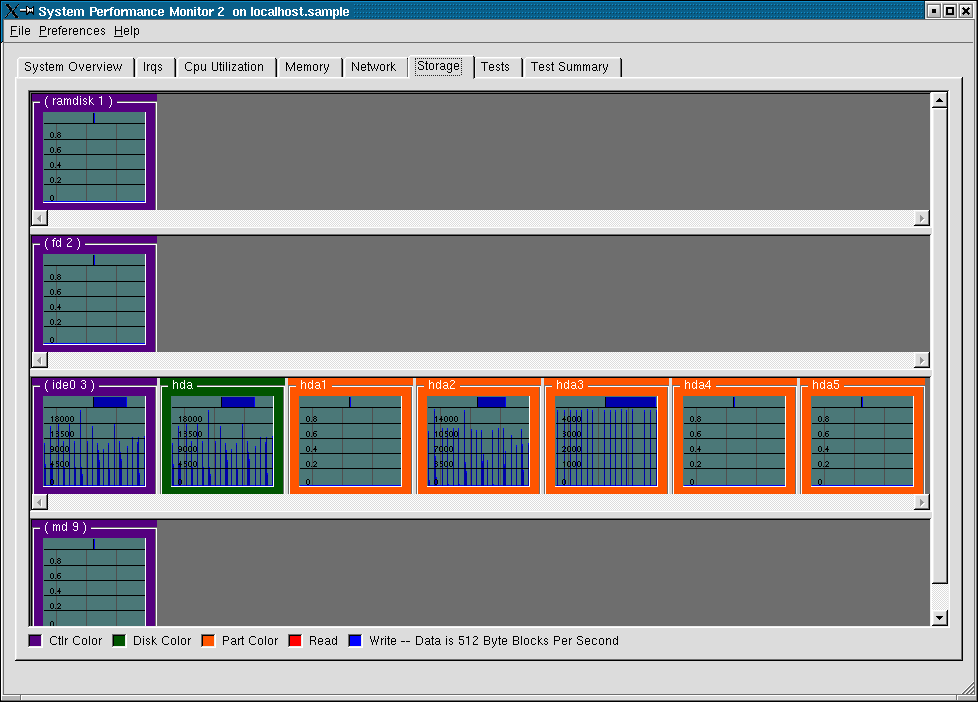
The screenshot
displays purple for controllers, green for disks, and orange for partitions.
The red lines represent
reads from the devices and the blue lines represent writes to the devices.
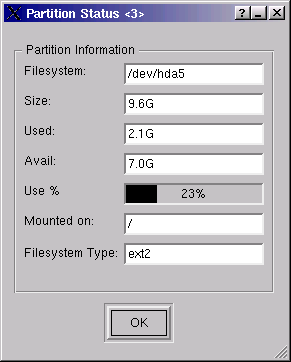
To see information about a partition (such as file system name, space used, and
space available), right-click the partition's histogram and then left-click . A
Partition Status window opens that displays information about the selected partition.
6.7. Tests tab
The Tests tab opens a list of tests that can be run on the system
and is useful, for example, for quality assurance personnel who need to load test systems when testing hardware or software.
6.8. Test Summary tab
The Test Summary tab contains test output and utilization numbers for test runs.
You can print these test results and keep them for your records.